The Almighty US Dollar
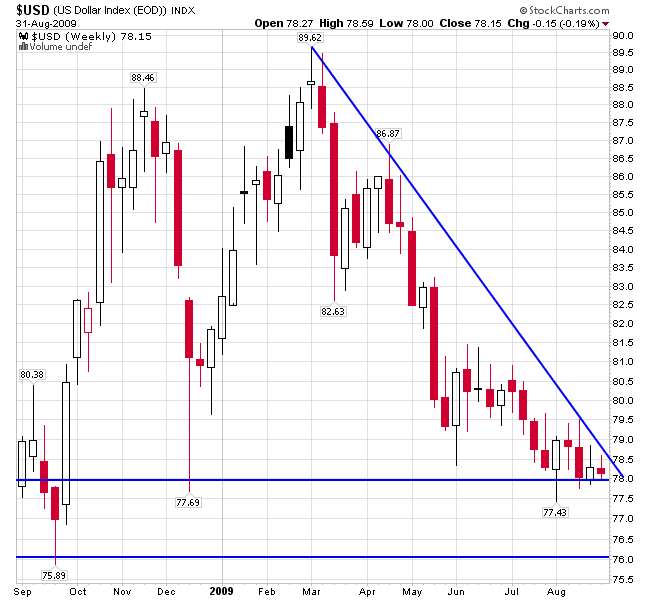
Looks like the dollar is breaking the downtrend line from March of this year. Needless to say, that is not a positive for the equity markets nor commodities.

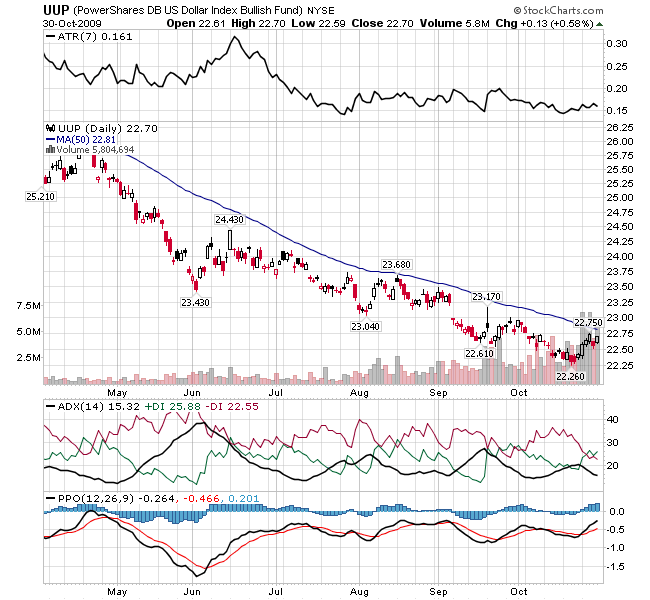
Let’s work on a simple trading strategy for trading the dollar either up or down. I will use the PowerShares UDN for bearish dollar and UUP for bullish dollar bets. I am going to use a 50 dma to indicate whether I want to be in the short or the long fund. Very simply, if it is trading above the 50 dma, then I want to buy it, if it is trading below then I want to sell it and switch to the other pair that should be trading above the 50 dma. Again, will show you a chart to demonstrate how simple this strategy is:

OK, easy enough, the dollar has been declining and the bearish dollar ETF UDN has been rising. It doesn’t take much of an imagination to figure out that UUP must have been declining:

In terms of setting a stop, you can use a multiple of the average true range or ATR (visible on the chart) and subtract this from the 50 dma. ATR isn’t simply the difference between the day’s low and high, but an average of the range of the stock. For example, if ETF X closed at 25, and the next day it traded with a low of 26 to a high of 28, the ATR isn’t 2, but 3 because it ranged from 25 to 28. Most charting sites or software will calculate this for you. I like to use an ATR of 7 (7 is a Fibonacci number as well), to get the average over 7 trading days. So to give a concrete example, when UUP crosses above the 50d, we can go long and set a stop slightly below the 50d. From the UUP chart we can see that the ATR is currently at 0.16. We want to allow it some fraction of the ATR before we get stopped out. You can use a calculation similar to this:
stop = MA – ATR*.85
This is very easy to write with Excel (feel free to e-mail me and I will send you one that will do the calculation for you provided you input the ATR and MA). Back to our example, to calculate our stop we need to know the ATR which is 0.16 and the MA, using the 50dma on Friday happens to be 22.81 giving us
stop = 22.81 – 0.16*.85
stop = 22.674 or round up to 22.68
Ideally, you want to be long a stock when the moving average is sloping upwards, that way the stop moves up with your stock and your risk decreases until eventually you have a profit locked in. Clearly since UUP has been in a downtrend for so long, the 50 dma is still sloping downwards so the stop will move lower if volatility as measured by ATR remains the same. Moving averages of shorter duration will follow the price of the stock faster, but also lead to more whipsaws or false signals.
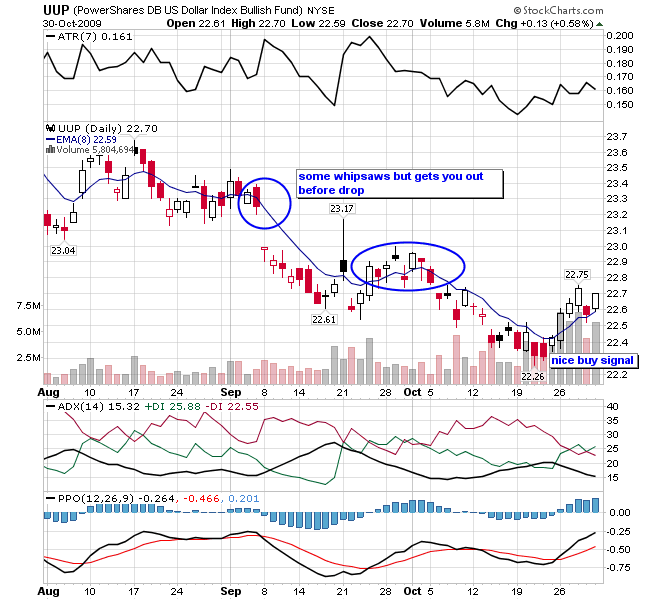
Take for example UUP using a 8 ema:

A good bit of whipsaws on the shorter term moving average, but an earlier buy signal than the 50 dma.
Let’s analyze the dollar on a weekly chart…
Not only commodities, but most all asset classes have been trading inverse to the $USD. The dollar holds the key as to when the correction will begin. It has been holding $78 lately. There is a small likelihood that it will correct to $76, corresponding with the market rallying and SPY filling its gap. Again the charts can do this analysis much more justice than any words.

Either the dollar is going to break up through the downtrend line, hence a rally for the $ and a correction for the market, or the $ is going to break support at $78 and head down to $76 area. That would correspond with a higher push in the markets and commodities. The important thing here is to watch the move in the $ over the next week or so.
You can also watch UUP , which is looking good on a daily chart today if it can get through the 50 dma slightly above:

